

The cause of a decision in Swahili social media sentiments
How a data professional can tell if Swahili social media sentiment is positive or negative?


This article was originally published in the neurotech Africa blog.
As a data professional one of the best practices is to be accountable for the solutions at hand, by understanding how the model you have built is performing and predicting the results. I came across Swahili social media sentiments and since I'm a Swahili speaker I was curious to understand the cause of decisions in Swahili sentiment analysis using machine learning algorithms.
In today's article, I will work with you through building a machine learning model for Swahili social media sentiment classification with the interpretability of each prediction of our final model using Local Interpretable Model-Agnostic Explanations.
“Why Should I Trust You?” Explaining the Predictions of Any Classifier ~ Marco Tulio Ribeiro, Sameer Singh and Carlos Guestrin.
Kiswahili is a lingua franca spoken by up to 150 million people across East Africa. It is an official language in Tanzania, DRC, Kenya, and Uganda. On social media, Swahili speakers tend to express themselves in their own local dialect.
Building Swahili social media sentiment classifier
Sentiment analysis relies on multiple word senses and cultural knowledge and can be influenced by age, gender, and socio-economic status. In today's task, I will be using datasets from Twitter originally hosted at Google Natural language processing hack series by zindi Africa, with the aim of classifying whether a Swahili sentence is of positive, negative, or neutral sentiment.
The dataset contains three columns which are id as the unique ID of a unique Swahili tweet, tweets containing the actual text of the Swahili tweet, and labels the label of the Swahili tweet, either negative(-1), neutral(0), positive(1) with 2263 observations.
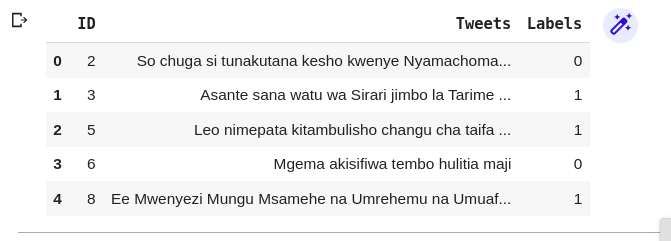
dataset preview from top
How about label distribution?
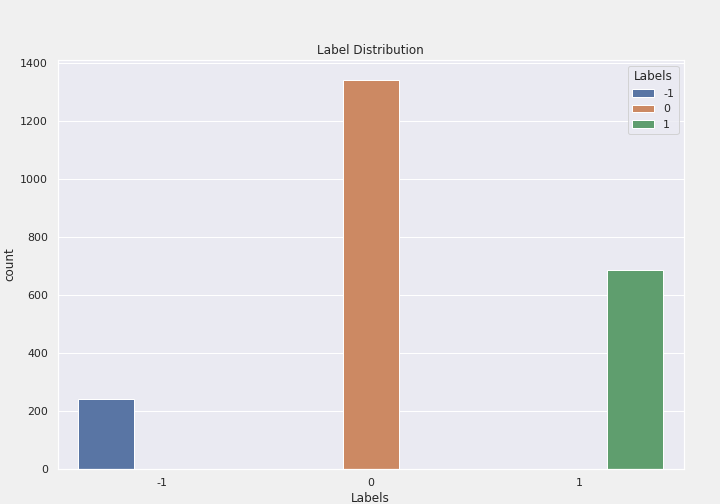
label distribution
Most of the tweets collected are neutral, which shows that our labels are imbalanced.
Let's work on preprocessing the dataset to make everything ready for building our final machine learning model. This will involve a range of steps for cleaning the texts
- removing non-alphanumeric text.
- removing stopwords
- converting all tweets into lowercase.
- removing punctuation, links, emojis, and white spaces.
- tokenize the text based on each word.
- the final piece is to append all clean tweets into new columns named
clean_tweets.
Point to note, nltk doesn't consist of Swahili stopwords but you have to create your own list and apply it to the tweets. I just created a CSV file with a couple of Swahili stopwords like na, kwa, kama, lakini, ya, take, etc which I will apply here.
Stop words are a set of commonly used words in any language. For example, in English, “the”, “is” and “and”, would easily qualify as stop words. In NLP and text mining applications, stop words are used to eliminate unimportant words, allowing applications to focus on the important words instead.
To make things smooth let's just use one function to perform all of the tasks.
def clean_tweets(tweet):
    '''
        function to clean tweet column, make it ready for transformation and modeling
    '''
    tweet = tweet.lower() #convert text to lower-case
    tweet = re.sub('[‘’“”…,]', '', tweet) # remove punctuation
    tweet = re.sub('[()]', '', tweet) # remove parenthesis
    tweet = re.sub("[^a-zA-Z]"," ",tweet) #remove numbers and keep text/alphabet only
    tweet_list = nltk.word_tokenize(tweet)
    clean_tweets=[i for i in tweet_list if i not in swstopwords] # remove stop words
    return ' '.join(clean_tweets)

   df['clean_tweets'] = df['Tweets'].apply(clean_tweets)
function to clean tweet column, make it ready for transformation and modeling
Now the tweets are clean and ready for further processes
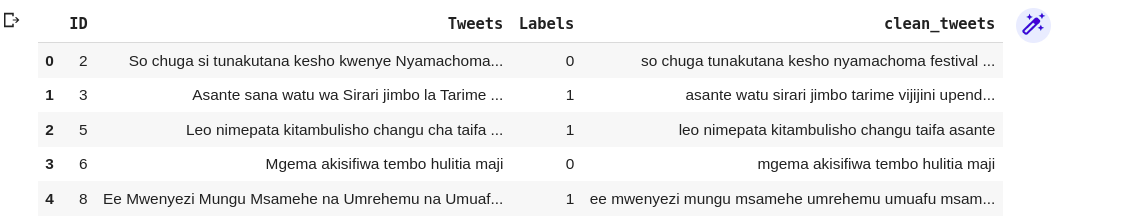
datasets after applying the clean_tweet function
Time to work on the analysis of the Swahili tweets by looking at polarity and subjectivity. But wait! what do polarity and subjectivity mean?
Polarity is the expression that determines the sentimental aspect of an opinion. In textual data, the result of sentiment analysis can be determined for each entity in the sentence, document, or sentence. The sentiment polarity can be determined as positive, negative, and neutral. Usually defined as a float that ranges from 1 (entirely positive) to -1 (entirely negative)
Sentiment polarity for an element defines the orientation of the expressed sentiment, i.e., it determines if the text expresses the positive, negative or neutral sentiment of the user about the entity in consideration.
Subjectivity is the measure of how factual the text is, ranging from 0 (pure fact) and 1 (pure opinion)
I will be using textblob to analyze tweets
def polarity_score(tweet):
  '''
        This function takes in a text data and returns the polarity of the text
        Polarity is float which lies in the range of [-1,0,1] where 1 means positive statement, 0 means positive statement
        and -1 means a negative statement
    '''
  return TextBlob(tweet).sentiment.polarity

  def subjectivity_score(tweet):
  '''
      This function takes in a text data and returns the subectivity of the text.
      Subjectivity sentences generally refer to personal opinion,
      emotion or judgment whereas objective refers to factual information.
      Subjectivity is also a float which lies in the range of [0,1].
  '''
  return TextBlob(tweet).sentiment.subjectivity

  #apply above functions to the data
df['polarity_score']=df['clean_tweets'].apply(polarity_score)
df['subjectivity_score']=df['clean_tweets'].apply(subjectivity_score)
polarity score
Now let's try to aggregate the overall polarity and subjectivity of the entire dataset
The overall polarity of the tweet data is 0.01
The overall subjectivity of the tweet data is 0.03
The overall polarity of the tweet data indicates that the tweets are fairly neutral.
Let's try to visualize the polarity and subjectivity distributions of each class independently
# visualization
fig = make_subplots(rows=3, cols=2,subplot_titles=("Polarity Score Distribution-Negative", "Subjectivity Score Distribution-Negative",
                                                   "Polarity Score Distribution-Neutral", "Subjectivity Score Distribution-Neutral",
                                                   'Polarity Score Distribution-Positive','Subjectivity Score Distribution-Positive'),
                    x_title="Score",y_title='Frequency')
fig.add_trace(
    go.Histogram(x=df[df['Labels']== -1 ]['polarity_score']),
    row=1, col=1)
fig.add_trace(
    go.Histogram(x=df[df['Labels']== -1 ]['subjectivity_score']),
    row=1, col=2)
fig.add_trace(
    go.Histogram(x=df[df['Labels']== 0 ]['polarity_score']),
    row=2, col=1)
fig.add_trace(
    go.Histogram(x=df[df['Labels']== 0 ]['subjectivity_score']),
    row=2, col=2)
fig.add_trace(
    go.Histogram(x=df[df['Labels']== 1]['polarity_score']),
    row=3, col=1)
fig.add_trace(
    go.Histogram(x=df[df['Labels']== 1]['subjectivity_score']),
    row=3, col=2)
fig.show(renderer="colab")
visualization of polarity and subjectivity of each class
Now here we go,
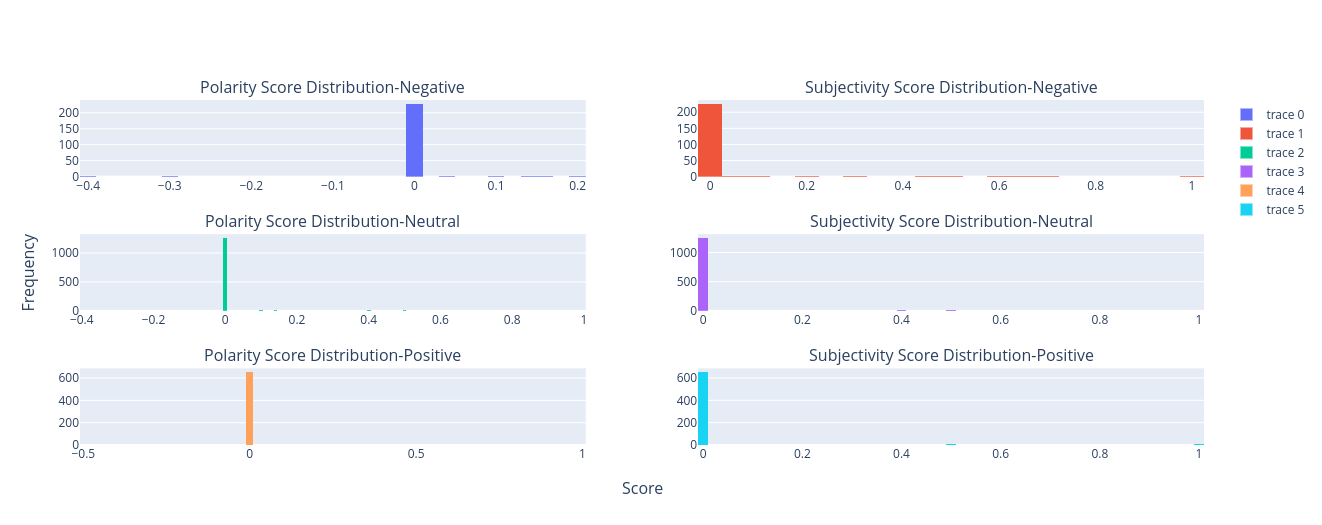
distribution of each class on polarity and subjectivity
In terms of Subjectivity, all three classes tend to be similar no significant difference can be stated, but the polarity of the negative class is different from the positive and neutral classes in terms of skewness.
Let's try to understand the content by visualizing the most used words in all classes and later we can jump to each class independently.
word_freq=pd.DataFrame(df['clean_tweets'].str.split(expand=True).stack().value_counts()).reset_index()
word_freq=word_freq.rename(columns={'index':'Word', 0:'Count'})
fig = px.bar(df, x=word_freq['Word'][0:20], y=word_freq['Count'][0:20])
fig.update_layout(xaxis_title="Word", yaxis_title="Count", title="Top 20 most Frequent words in across entire tweet data")
fig.show(renderer="colab")
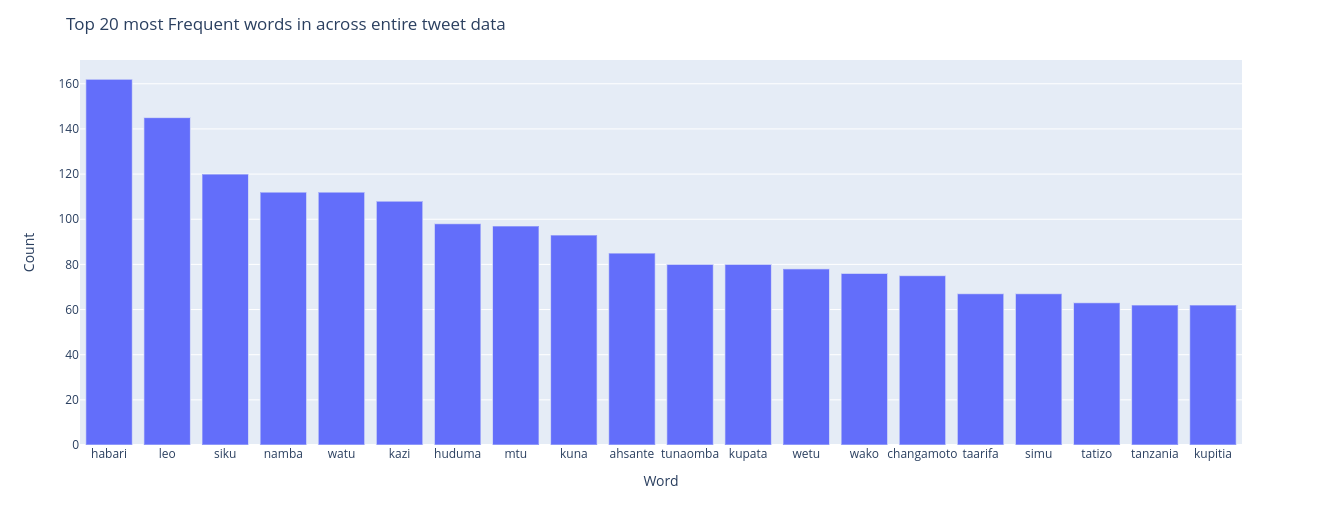
Top 20 most frequent words
habari, leo, siku, namba are the top frequent words in the overall tweet contents.
# Negative Tweets Word Frequency
word_freq_neg=pd.DataFrame(df[df['Labels']== -1]['clean_tweets'].str.split(expand=True).stack().value_counts()).reset_index()
word_freq_neg=word_freq_neg.rename(columns={'index':'Word',0:'Count'})

# Neutral Tweets Word Frequency
word_freq_neut=pd.DataFrame(df[df['Labels']== 0]['clean_tweets'].str.split(expand=True).stack().value_counts()).reset_index()
word_freq_neut=word_freq_neut.rename(columns={'index':'Word',0:'Count'})

# Positive Tweets Word Frequency
word_freq_pos=pd.DataFrame(df[df['Labels']== 1]['clean_tweets'].str.split(expand=True).stack().value_counts()).reset_index()
word_freq_pos=word_freq_pos.rename(columns={'index':'Word',0:'Count'})

fig = make_subplots(rows=1, cols=3,subplot_titles=("Top 20 most frequent words-Negative", "Top 20 most frequent words-Neutral", "Top 20 most frequent words-Positive"),
                    x_title="Word",y_title='Count')
fig.add_trace(
    go.Bar(x=word_freq_neg['Word'].iloc[0:20], y=word_freq_neg['Count'].iloc[0:20]),
    row=1, col=1
    )
fig.add_trace(
    go.Bar(x=word_freq_neut['Word'].iloc[0:20], y=word_freq_neut['Count'].iloc[0:20]),
    row=1, col=2
    )
fig.add_trace(
    go.Bar(x=word_freq_pos['Word'].iloc[0:20], y=word_freq_pos['Count'].iloc[0:20]),
    row=1, col=3
    )
fig.show(renderer="colab")
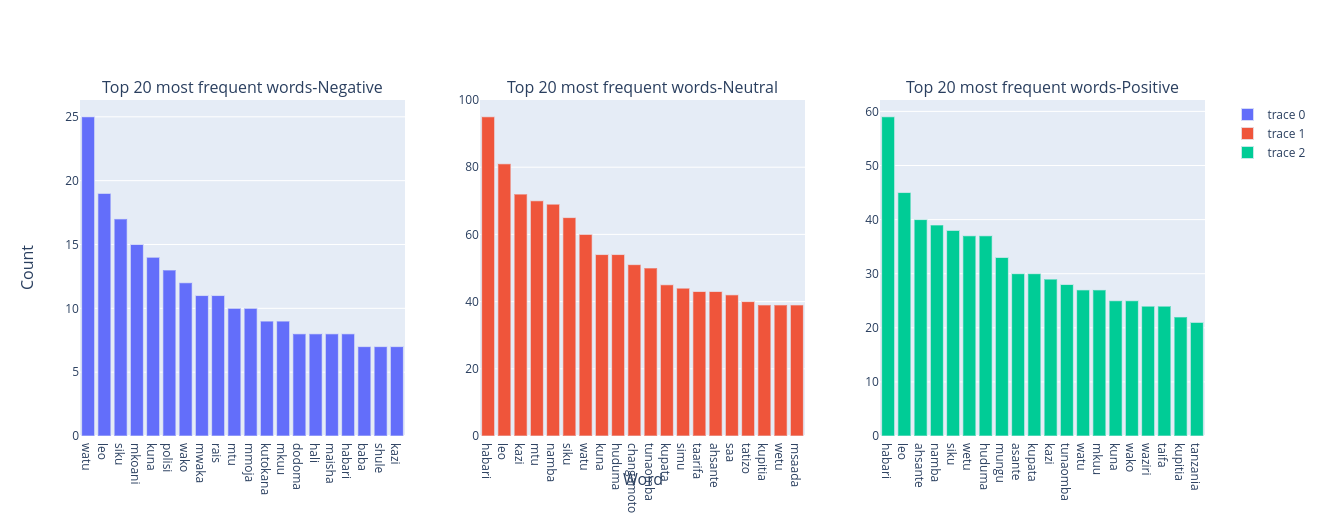
Top 20 most frequent words in each class
Across the negative class tweets, the most used words are watu, leo and siku , across the neutral class tweets, the most used words are habari, kazi and mtu and across the positive class tweets, the most frequently used words are habari, leo, asante.
Let's prepare our final dataset for modeling by splitting it into two groups(train and test)
# data split
X = df["clean_tweets"]
y = df["Labels"]

seed = 42

x_train,x_test,y_train,y_test= train_test_split(X,y,stratify=y, test_size=0.2, random_state=seed)
Then, I can make our data pipeline ready for training Swahili sentiments by defining TfidfVectorizer as a vectorizer and LogisticRegression as an algorithm for building our model. Using initialized pipeline, I can train the classifier using the training set of tweets.
# instantiating model pipeline
model = make_pipeline(
    TfidfVectorizer(),
    LogisticRegression()
)

# training model
model.fit(x_train,y_train)
Great! I have trained our classifier for Swahili social media sentiments, and now it's time to evaluate the performance of our model.
print("Classification Report")
print("\t", "_" * 45, "\n" * 2)
print(
    classification_report(
        y_test,
        model.predict(x_test),
        target_names=["Negative", "Neutral","Positive"]
        )
    )
With the classification report, the performance is not very good, our model has a 60% accuracy
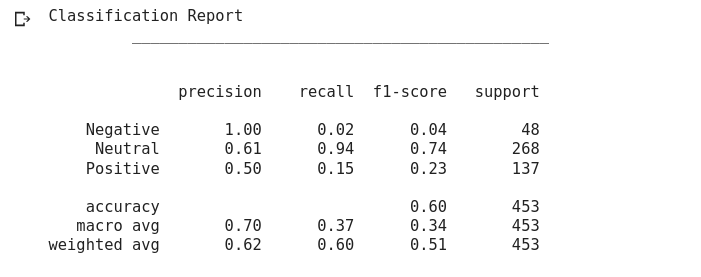
classification report
Results Interpretability
It's time to understand the cause of the decision of our classifier, we should bring LIME to help us in the interpretation of each prediction of our model, for understanding let me opt to filter out three kinds of prediction(negative, neutral, and positive).
The higher the interpretability of a machine learning model, the easier it is for someone to comprehend why certain decisions or predictions have been made. A model is better interpretable than another model if its decisions are easier for a human to comprehend than decisions from the other model.
I should consider predicting probabilities with a LogisticRegression classifier instead of 0 or 1 simply because LIME requires a model that produces probability scores for each prediction to explain the decision's cause.
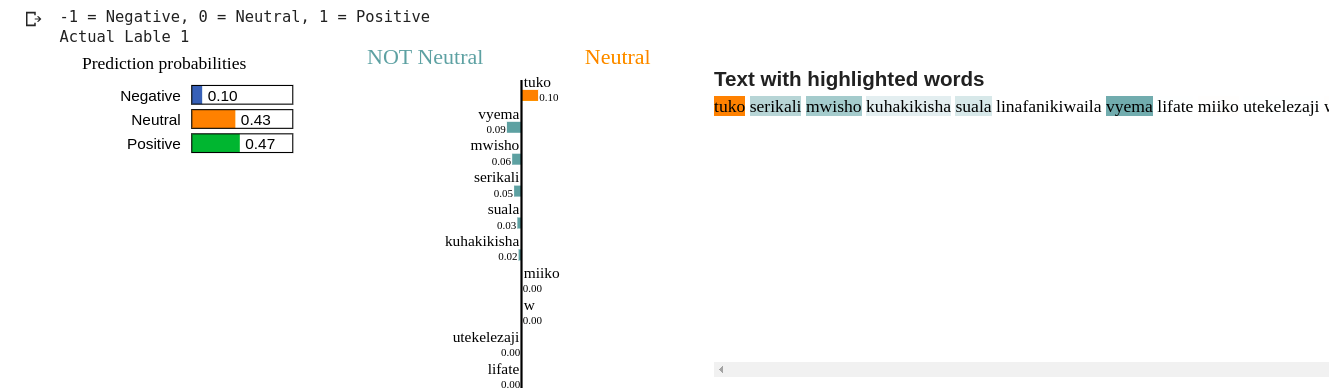
positive prediction
Here we go, the above observation shows that the probability of a positive class is higher(0.47) compared to other classes, and the cause of decision by words serikali, mwisho and vyema way back in our previous visualization of top frequent words for the positive class to conclude the classifier decision.
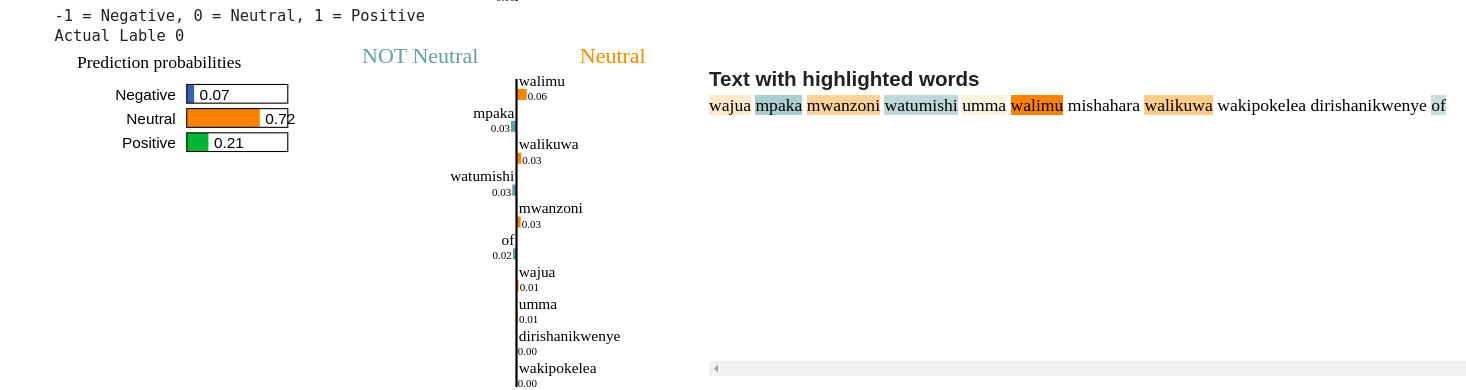
neutral prediction
The above observation shows that the probability of a neutral class is higher(0.72) compared to the other two classes, and the cause of the decision comes from words walimu, walikuwa, and mwanzoni .
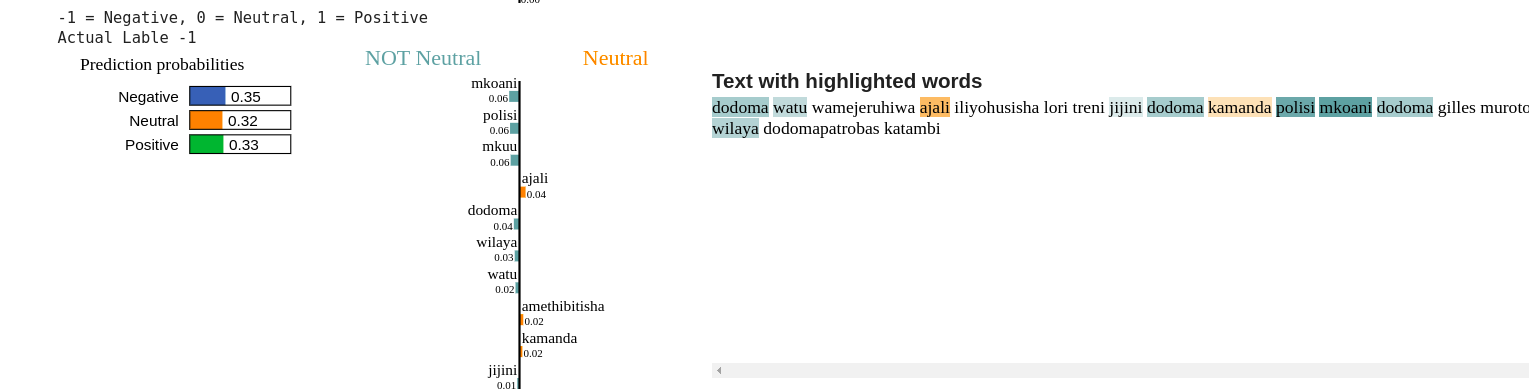
negative prediction
The above observation shows that both of the three classes weigh comparable but due to the high weighting of the word polisi the tweet predicted a negative class.
How companies can benefit from customer sentiment analysis?
Sentiment analysis can help to understand the potential of customers to see an overview of what’s good, and what’s lacking. This can help to improve the strategy of marketing and operations based on customer sentiments.
The power of deep insights from sentiment can help capture what specifically people don’t like about the service, product, or policy and after the business has taken steps to fix the issue, or improve a process, also can track how that has improved customer satisfaction. Insights from customer sentiments can also differentiate between feedback that is frequent and feedback that influences satisfaction scores.
Final thoughts
Understanding the cause of the decision of individual predictions from classifiers is important for data professionals. Having explanations lets you make an informed decision about how much you trust the prediction or the model as a whole, and provides insights that can be used to improve the model.
The complete code used in this article can be found on the GitHub repository.